
The ability of wetlands to improve water quality in different applications (e.g., municipal, industrial, and agriculture) has been well-studied. The research has shown that wetlands, particularly treatment wetlands, are very effective at removing excess nutrients, herbicides/pesticides, heavy metals, etc. While I love reading and diving deep into this research, it is not necessarily exciting reading to our farmers. They are more interested in seeing firsthand a tile-treatment wetland on a local working row-crop farm and the proof that this investment is working as promised.
So, we have been partnering with professors and students at local universities and colleges to monitor the water quality going into and out of three Smart Wetlands that we designed and implemented with our landowners. We have nine years of monitoring data between the three wetlands.
To evaluate nutrient removal, we take samples for nutrient concentrations at the inlet and outlet of each wetland and measure the water flow. With these two measurements, we can calculate nutrient mass or pounds of nitrate and phosphorus removed by the wetland. Several parameters can impact nutrient removal, such as the inlet concentration, flow rate (impacted by rainfall), temperature, wetland age, soil organic carbon, plant community development, flow pattern, etc. Below are just a few results highlights comparing the three monitored wetlands with some short explanations. Check in with this website and Smart Wetlands’ social media in the future to see more data being presented and research findings explained.
TWI designed and implemented two wetlands in Bureau County, “BC1” in 2015 and “BC2” in 2016. In partnership with the University of Illinois-Chicago (UIC), water quality monitoring began the following spring or summer as the wetland plant community entered its first growing season.
Flow was monitored continuously and water quality samples were taken at the inlet and outlet daily. While both wetlands successfully remove nitrate-nitrogen, there are differences between the two wetlands in terms of efficiency (Figure 1A) and amount of mass removed (Figure 1B). The differences can be attributed to design and site factors.
The BC1 and BC2 wetland sites are similar in size; however, the treatment area of BC1 is around 1% of the contributing drainage area, whereas BC2’s treatment area to contributing drainage area is 3.6%. BC1 had upland soils as its base media growth, whereas BC2 had a hydric soil base (wetland/saturated soil) that was more carbon-rich, allowing more denitrification to occur right from the start. As the carbon levels built up in BC1 after each growing season, its removal efficiency increased, except in the fall of 2017 when the wetland dried up and the carbon was released as CO2 to the atmosphere. BC2 has never dried up due to a more consistent inlet flow throughout the year, particularly in the summer, so its carbon level continued to increase.

Figure 1A. Nitrate-nitrogen removal efficiency for BC1 (blue bars) and BC2 (green bars) over the sampling years.

Figure 1B. The total amount of nitrate removed in pounds
In 2019, a TWI-designed tile-treatment wetland was installed on Illinois Central College’s Demonstration Farm on the East Peoria campus. Its soil base was upland soils. Through a collaboration between TWI, ICC, Illinois Corn Growers, Waterborne Environmental, and Illinois State University, rigorous data collection began in 2021 for the tile-treatment wetland. To date, data has been analyzed through May 2022.
Unlike the Bureau County wetlands, the ICC samples are taken based on a set volume passing the collection point versus daily, so these samples essentially capture rainfall events when the “first flush” of nutrient flow through the tile drainage. The data show that the nitrate levels leaving the wetland are much lower than the inlet concentrations.
In 2021, we saw zero nitrate leaving the system in some cases, as evaporation was greater than the flow into the wetland (see Figure 2). In spring 2021, the wetland was exporting nitrate and total phosphorus and dissolved phosphorus. This may be due to the soils and sediments getting disturbed and mixed by the heavy rainfall or the presence of waterfowl nesting and feeding in the wetland.
Our water quality monitoring at all three wetlands demonstrates that the sites effectively remove significant nutrients from tile drainage water over a large part of the year. Our findings have also pointed to ways that we can further enhance the practice to make Smart Wetlands work even harder!
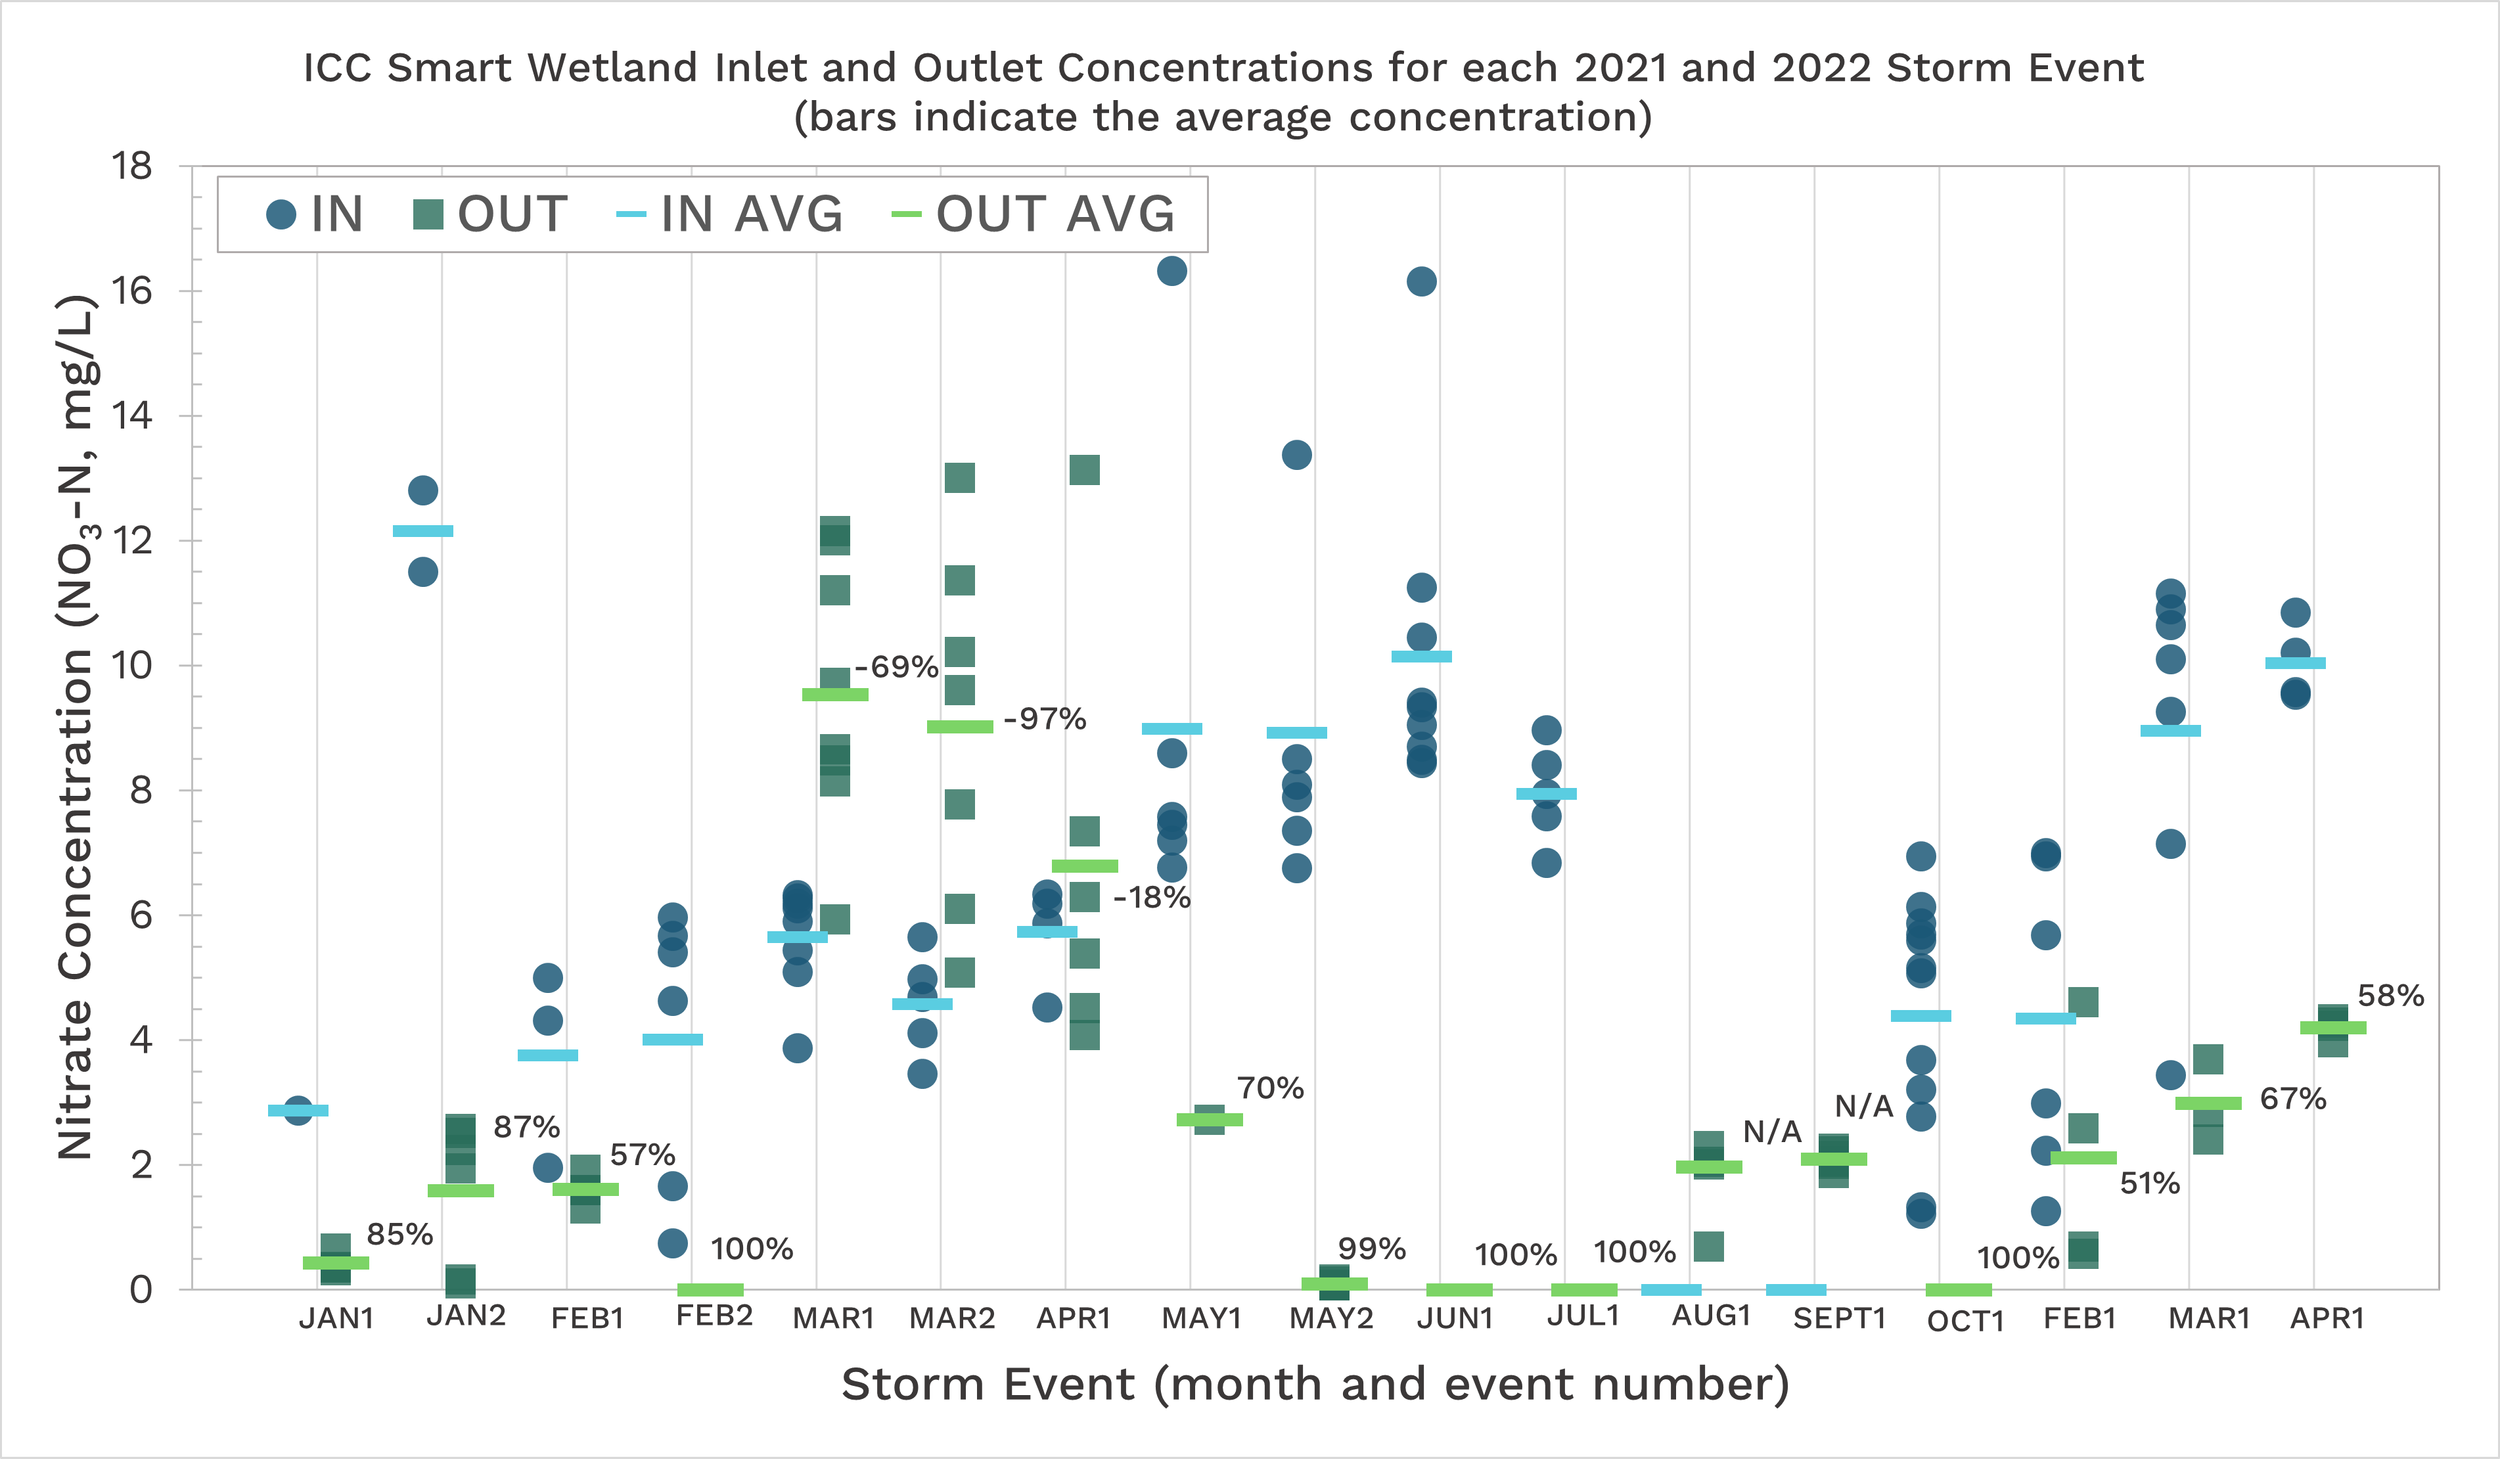
Figure 2. The inlet (blue dots) and outlet (green squares) concentrations for the Illinois Central College Smart Wetland for each storm event. The blue and green bars represent the average concentration for the inlet and outlet, respectively, for each storm event. The % number represents the removal efficiency based on the average concentrations. N/A means that no inlet samples were taken due to autosampler error.
Jill Kostel leads the project team as TWI’s Senior Environmental Engineer and primary designer of Smart Wetlands. She also works to develop new partnerships to help spread constructed wetlands widely in Illinois.
The Mississippi River Network provided support for developing this blog. Consider becoming a River Citizen to help “clean up and protect our country's greatest River.”